Trade Case Study Examples
Exports, Foreign Investment and the Trade Balance
The link between trade, foreign investment and the trade balance is not well understood. We have several ways for trying to explain this relationship mathematically, but still students struggle to understand why the trade balance is driven by foreign investment and not trade. Here is the mathematical background and a few exercises that are designed to help you think about it.
The basic relationship between trade and investment is often given by:
Where X is exports; IM is imports; NFY is net foreign income received (e.g., remittances or income on ownership of capital abroad or foreign aid); S is domestic private savings; I is domestic investment; T is taxes or government revenue; G is government spending and NCI is net capital inflow (or foreign investment).
This relationship states that the trade balance X – IM (plus any net foreign income received NFY) is equal to the extent to which domestic private savings covers domestic investment and any government deficit (G – T) . If domestic savings cover domestic investment and any government deficit, then there will be a trade surplus. If domestic savings is not sufficient, then there will be a trade deficit and foreign investment (NCI) is required to fund the excess investment and government deficit that domestic savings cannot.
This relationship can be derived in several ways:
- By recognizing that a country’s consumption should equal its income:
- Using demand and supply for the currency or balance of payments:
If Income = GDP + NFY = C + I + G + X - IM + NFY, and Consumption = C + S + T, then:
C + I + G + X - IM + NFY = C + S + T
X - IM + NFY = (S – I) + (T – G)
Where: GDP is gross domestic product; NFY is net foreign income inflows (e.g., remittances, foreign capital income, etc).
In countries with floating exchange rates the balance of payments equals zero and hence Demand for currency = supply of currency. In the table below we see some examples of demand and supply of currency.
| Demand | Supply | Example |
|---|---|---|
| Exports | Imports | Nigeria finds and export oil |
| Net Capital inflows | Outflows | Increased FDI in Thailand |
| Increased demand for Euros as a world reserve currency by China | ||
| Net Foreign Income inflows | Outflows | US lowers tax on foreign income earned abroad |
| Net Foreign remittances inflows | Outflows | India suffers recession and remittances rise |
| Net Foreign aid inflows | Outflows | Malawi suffers drought and foreign aid rises |
If demand = supply of a currency, then:
Note that net inflows include both net foreign income (NFY) (remittances, income and foreign aid) and Net capital flows (NCI including demand as a world reserve currency).
And from above we know that net capital inflows (NCI) fund the extra investment and government deficit that domestic savings cannot:
Hence:
Questions
- The table above contains a number of examples. Assuming floating exchange rates, how will each of these examples impact the exchange rate and trade balance of the country listed in column 2.
- The Trump administration has negotiated approximately 15 trade deals since entering office in January 2025, including deals with Argentina, the EU, Japan, Malaysia, South Korea, and the United Kingdom. Many of the deals have involved limits being placed on tariff increases in return for increased investment in the USA.
- Explain how an increase in foreign investment, negotiated as part of these trade deals, could impact the US trade balance and hence the US exports?
- Explain how an increase in tariffs could impact the US trade balance? Use the table below to help guide you.
| Example | Country |
|---|---|
| Nigeria finds and export oil | Nigeria |
| Increased Foreign Direct Investment (FDI) in Thailand | Thailand |
| Increased demand for Euros as a world reserve currency by China | Europe |
| US lowers tax on foreign income earned abroad | USA |
| India suffers recession and remittances rise | India |
| Malawi suffers drought and foreign aid rises | Malawi |
| What could happen? | Change in demand/supply | Exchange Rate? | Trade balance? |
|---|---|---|---|
| Tariffs raise cost of imports | Impact on Trade? | ||
| Tariffs raise cost of imported intermediates and hence price of US goods | Impact on Trade? | ||
| Tariffs raise cost of imported capital goods and reduce US rate of return on investment | Impact on Investment? |
Impact of Tariffs on Aluminum and Steel
In 2018, the US government raised tariffs on imported steel and aluminum from the European Union (EU), Canada, China, amongst others. In class we use a basic tariff diagram (Figure 1) to show the impact of raising or lowering tariffs on the importing country. When the tariff rises, prices rise, domestic supply rises and demand falls.
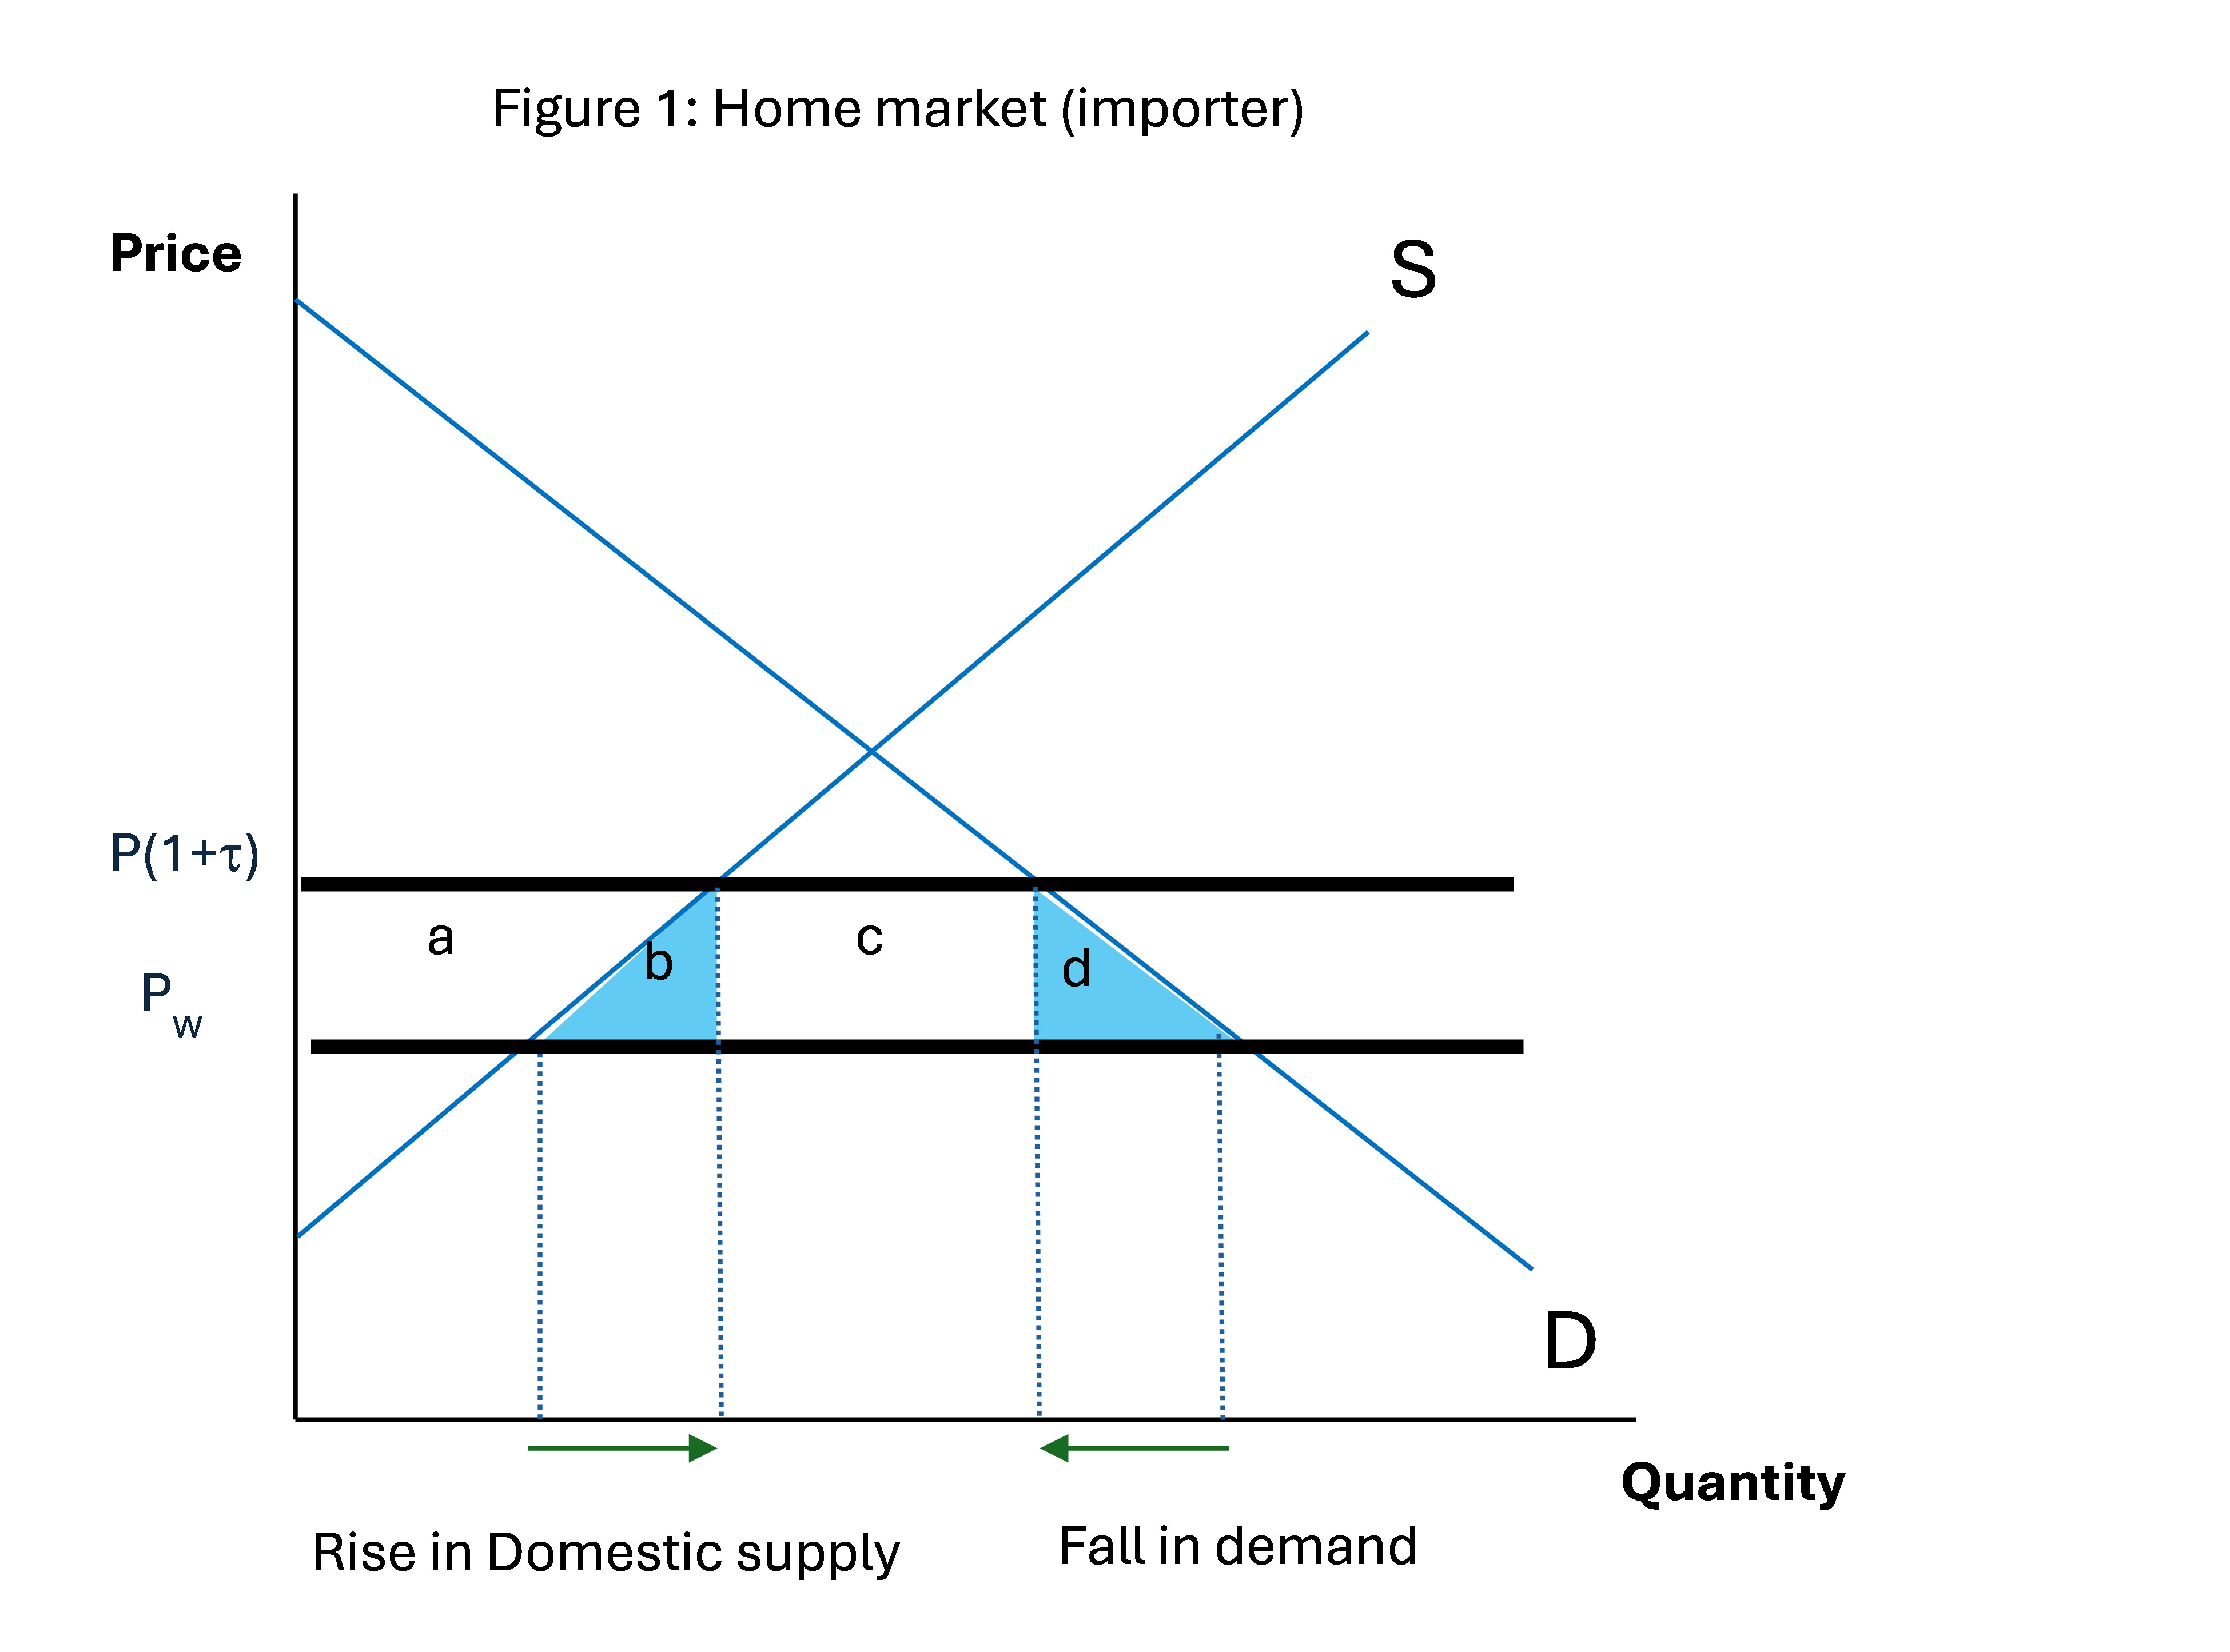
Where: PW is the free on board (fob) price and PW(1+τ) is the tariff inclusive price paid by the home consumer.
The rise in tariffs from zero to τ reduces imports and raises domestic production. We can then examine the impact on welfare:
Consumer surplus: + (a + b + c + d)
Producer surplus: - a
Govt revenue – (c)
Total welfare change: b + d
The total change in welfare is b + d, where b is an efficiency loss and d is a loss in consumption. Imports also fall.
While you may consider this to be a simple case of raising a tariff, there were so many aspects to this policy that it makes a great case study for looking at several issues in trade policy analysis. Below are a few of the issues raised in newspaper articles and in the economic analysis of this policy:
- While a key reason for the tariff was the desire to help blue-collar workers in these industries, it is likely that more blue-collar workers in the US lost jobs than gained jobs as a result of this policy. Why?
- The President allowed countries to negotiate prior to the implementation which resulted in a range of policies being implemented. As a result some countries were able to negotiate quotas (Argentina), tariff-rate quotas (EU) and even no tariff or quota (Australia). What difference does it make which policy is used?
- It was generally believed that China was dumping steel on the world market causing lower world prices and negatively impacting other exporters. Does the US raising tariffs help or hinder this situation?
- There are also a number of important legal issues as well. Can a country raise tariffs to help workers under US and International law? How could the US justify these tariffs?
Below are a few newspapers you may find interesting to read on this topic before looking at these questions.
- Factory workers aren’t getting what Trump promised, The Washington Post, by Catherine Rampell
- How Trump’s Protectionism Could Backfire (Published 2018)
- Alcoa CEO explains why aluminum tariffs are hurting, not helping
- U.S. reaches deal with European Union over steel and aluminum tariffs
- WTO finds US steel, aluminum duties violate trade rules | S&P Global
Questions: Impact of US Aluminum and Steel tariffs on other sectors and workers
- Show the impact of raising steel and aluminum tariffs on the US motor vehicle industry.
- Explain how raising tariffs on steel and aluminum could impact US investment and construction.
- Explain how Alcoa is likely to be impacted by the aluminum tariffs (see newspaper articles above)?
- Can you explain why employment of blue-collar workers would decline from raising tariffs on aluminum and steel?
Questions: Impact of US Aluminum and Steel tariffs on world prices
- What is dumping and how does dumping by China impact world prices and US imports from other countries?
- Explain how US tariffs on steel and aluminum could reduce world prices?
- Explain why the EU was unhappy with the US tariff?
- Under what circumstances does US and International law allow the USA to raise tariffs?
Comparison of Quotas and Tariff-rate Quotas on Aluminum and Steel
In 2018, the US government raised tariffs on imported steel and aluminum from the European Union (EU), Canada, China, amongst others. In the lead up to implementing the tariffs, the US President allowed countries to negotiate. This led to a range of policies being implemented. As a result some countries were able to negotiate quotas (Argentina), tariff-rate quotas (EU) and even no tariff or quota (Australia). Clearly Australia did well, but what about Argentina and the EU?
Questions
Compare and contrast the short and long run (e.g., after an increase in US demand) impact of the following policies from the perspective of the exporter:
- US imposes a tariff on 25 percent
- US impoises a quota of 20 percent more than current volumes
- US imposes a tariff rate quota with a quota of 20 percent more than current volumes, an in-quota tariff rate of zero and out-of quota tariff rate of 25 percent
Free Trade Agreements and Trade Diversion
Trade diversion is when a country diverts trade from a low-cost producer to a high-cost producer because of the reduction of tariffs or other change in protection. For instance, when the USA charges lower tariffs on goods from Mexico, this reduces the price of Mexican goods to US consumers, compared to goods from other countries, e.g., Thailand. The result of the FTA is that US consumers will buy less from Thailand and more from Mexico.
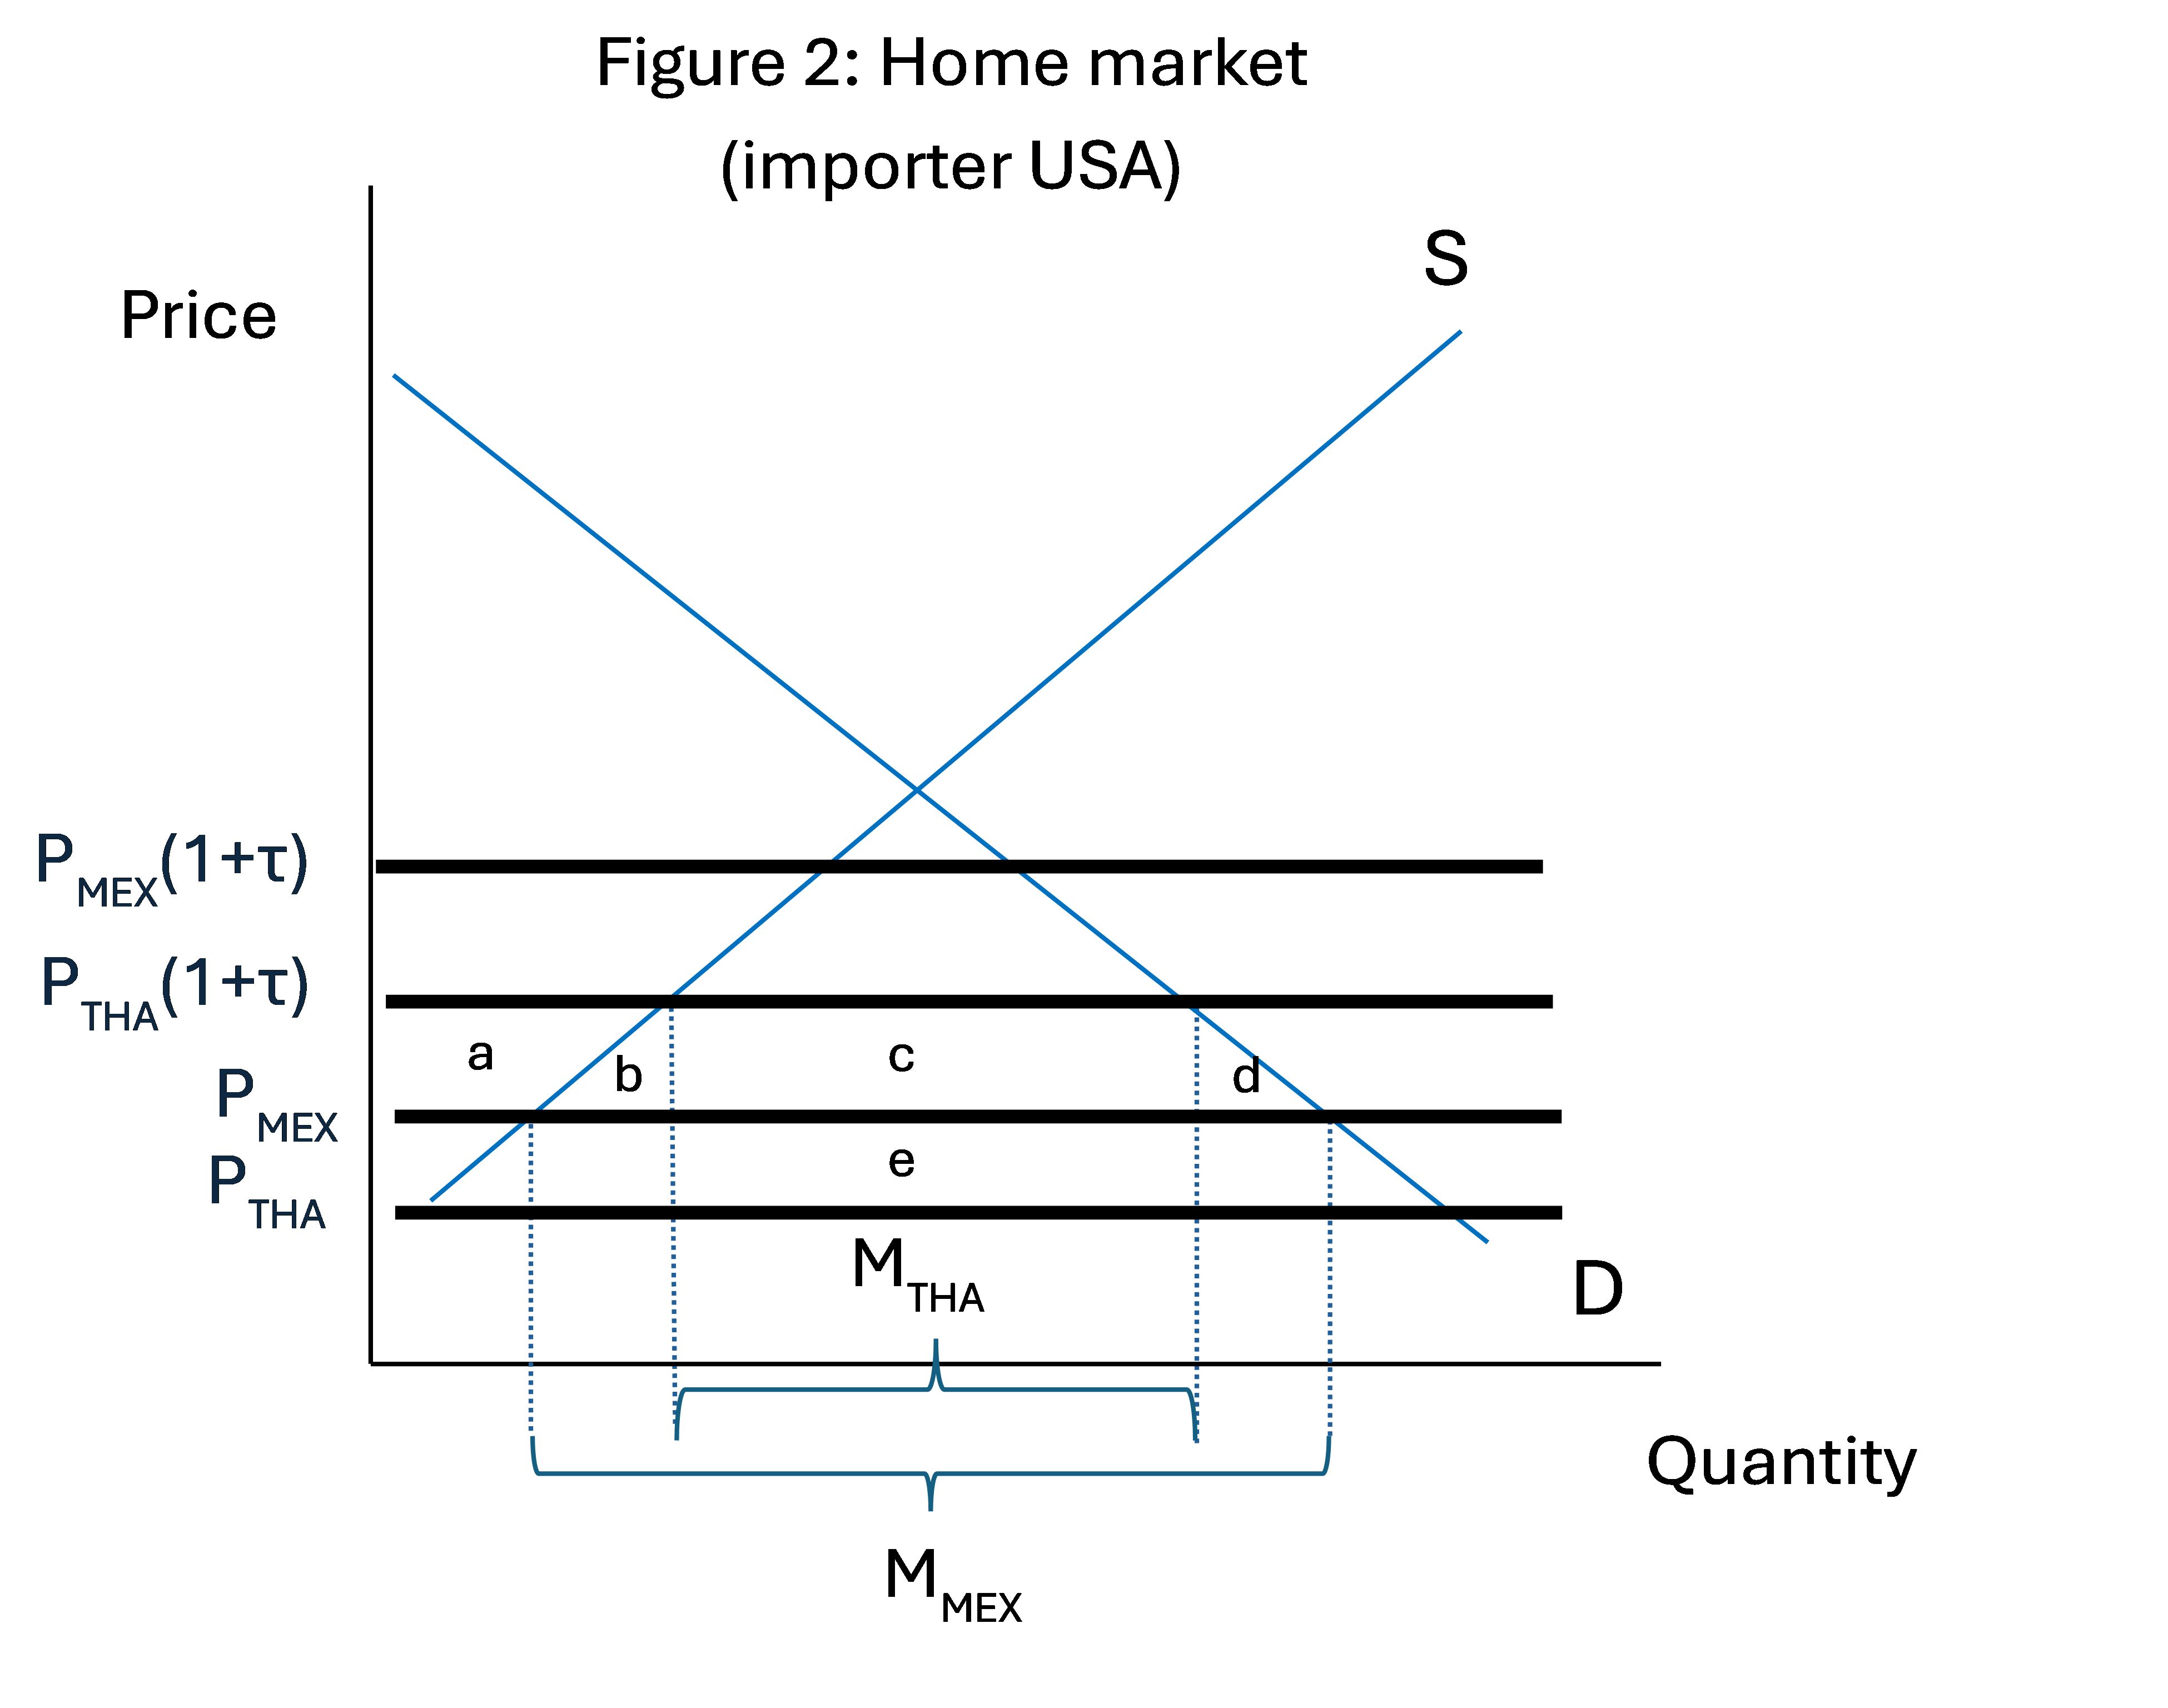
Figure 2 illustrates this trade diversion. Notice that each country is assumed to have perfectly elastic supply curves and consumers switch between suppliers depending on relative prices. Where PTHA represents the fob price (or costs of production plus transportation) of goods from Thailand and PTHA(1+τ) is the tariff inclusive price paid by US consumers.
Initially, the USA applies a tariff to goods from both Thailand and Mexico. In the case drawn in Figure 2, US consumers would purchase the amount MTHA from Thailand, because the price of the Thai good inclusive of tariffs in lower than the Mexican good inclusive of tariffs (PTHA(1+τ) < PMEX(1+τ)). However, if the US forms a FTA with Mexico in which the tariff on Mexican goods is removed, US consumers will switch from buying Thai goods to buying Mexican goods (PTHA(1+τ)> PMEX). This is trade diversion because US consumers are purchasing goods from the high-cost supplier, Mexico (PMEX > PTHA). We can then examine the impact on welfare:
Consumer surplus: + (a + b + c + d)
Producer surplus: - a
Govt revenue – (c + e)
Total welfare change: b + d - e
Area e represents the loss from trade diversion – US consumers buy from a higher-cost producer. The overall gain/loss depends on the whether the areas b + d outweigh the trade diversion effect e.
Questions
The Regional Comprehensive Economic Partnership (RCEP) agreement is the largest free trade agreement to be implemented to date, covering 30 percent of the world’s GDP. RCEP includes Australia, Brunei, Cambodia, China, Indonesia, Japan, South Korea, Laos, Malaysia, Myanmar, New Zealand, the Philippines, Singapore, Thailand, and Vietnam.
Most of the countries within RCEP (including Korea and Vietnam) are already linked to each other through a complex set of smaller overlapping trade agreements with zero tariffs and rules of origin clauses. In fact, only three of the 15 members are not in formal agreements with all the other RCEP members: Japan, South Korea and China. Japan does not have a free trade agreement with South Korea or China.
- Assuming Korea is a small country importer, show using a graph how the RCEP agreement could lead to an expansion of Korean imports from Japan and a reduction in imports from Vietnam. What are the welfare implications of this for Korea?
- Is this trade diversion?
- Why would Vietnam enter RCEP in this case?